The release is ready, the dashboard looks healthy, and then real traffic reaches one endpoint that nobody pushed hard enough in testing. Latency climbs, authentication starts failing, clients retry, and a dependency receives work the endpoint should have rejected. The incident rarely begins with a mysterious infrastructure problem. More often, the test measured a clean request path while production exercised the entire system around it.
To stress test an API endpoint safely, you need to separate true application capacity from failures caused by expired tokens, gateway throttling, connection setup, shared dependencies, or unrealistic test data. The useful result isn't a peak requests-per-second headline. It's a repeatable picture of latency, concurrency, error behavior, saturation, and recovery, with a ceiling you can defend before production traffic arrives.
Table of Contents
- Why Endpoint Stress Testing Fails Without a Plan
- Prerequisites and Safety Checks Before You Generate Load
- How to Run a Progressive Load Sequence That Finds the Ceiling
- Metrics That Actually Define Endpoint Capacity
- Automating Realistic Tests and Avoiding Misleading Results
- Your Next Test and How to Keep Results Reliable
Why Endpoint Stress Testing Fails Without a Plan
A load generator can report a high request rate while the endpoint itself remains barely tested. Reusing one expired access token measures authentication failure. A gateway that rejects requests before they reach the service makes its rate limit look like the application ceiling. Sending the same record repeatedly can also avoid the database contention created by real callers.
The endpoint is part of a system. Auth middleware, gateway quotas, connection pools, caches, databases, and downstream services can each become the first bottleneck. A useful plan identifies those boundaries and separates a genuine capacity limit from a test artifact.
Endpoint testing also answers a different question from a full user-journey test. A journey confirms that a broad workflow completes, but it can hide which operation slows first. Endpoint-level analysis applies to REST, gRPC, and GraphQL backends, allowing engineers to examine the latency, throughput, and errors for one operation under pressure, as described in this API performance testing overview.
The average hides the failure
Average latency can remain acceptable while a growing tail becomes unusable. Track p50, p95, and p99 latency with requests per second, concurrency, and error rate. Tail percentiles expose queueing, worker or connection pool exhaustion, lock contention, and slow downstream calls that an average conceals.
Concurrency answers a separate question from throughput. Two runs may produce similar requests per second while keeping very different numbers of requests active. The higher-concurrency run can expose worker limits, open-connection caps, or queue growth that a simple rate chart misses.
A practical guide to what stress testing means in practice frames the test as a search for failure behavior, not a contest for the largest number. Look for the point where the latency curve bends sharply, errors change from authentication or throttling failures to application or dependency failures, or recovery no longer returns the service to its prior state.
A progression beats a single blast
Use a baseline, then increase pressure through ramp, stress, soak, and spike phases. One benchmarking guide recommends checking whether the API handles 2x current peak traffic, then raising load until degradation appears while comparing the results with production baselines and SLA targets (API performance benchmarking guide).
Keep token refresh, authorization scope, rate-limit behavior, and representative downstream calls in the scenario. Otherwise, the run can produce a precise answer to the wrong question.
A useful result gives you three answers:
- Known ceiling: the load range where latency and error objectives still hold.
- Clear failure modes: whether overload causes timeouts, server errors, rejected requests, dependency failures, or resource saturation.
- Repeatable evidence: enough scenario detail for another engineer to reproduce the result for capacity planning or a CI/CD gate.
“Handled a lot of traffic” is not a capacity conclusion. It is only a starting observation.
Prerequisites and Safety Checks Before You Generate Load
The safest load test begins with a request that never gets sent. Confirm the scope, environment, credentials, data, observability, and rollback path before generating pressure. A load tool can be perfectly configured and still produce dangerous or useless results if it reaches the wrong service or shares state with production.
Start by writing down the exact authorized target and the allowed test window. Load testing must have explicit permission, especially when traffic crosses a provider, partner, shared gateway, or managed service boundary. Keep the initial run in an isolated staging environment with production-like configuration where possible, but don't assume staging has the same connection pools, autoscaling behavior, data volume, or dependency quotas.
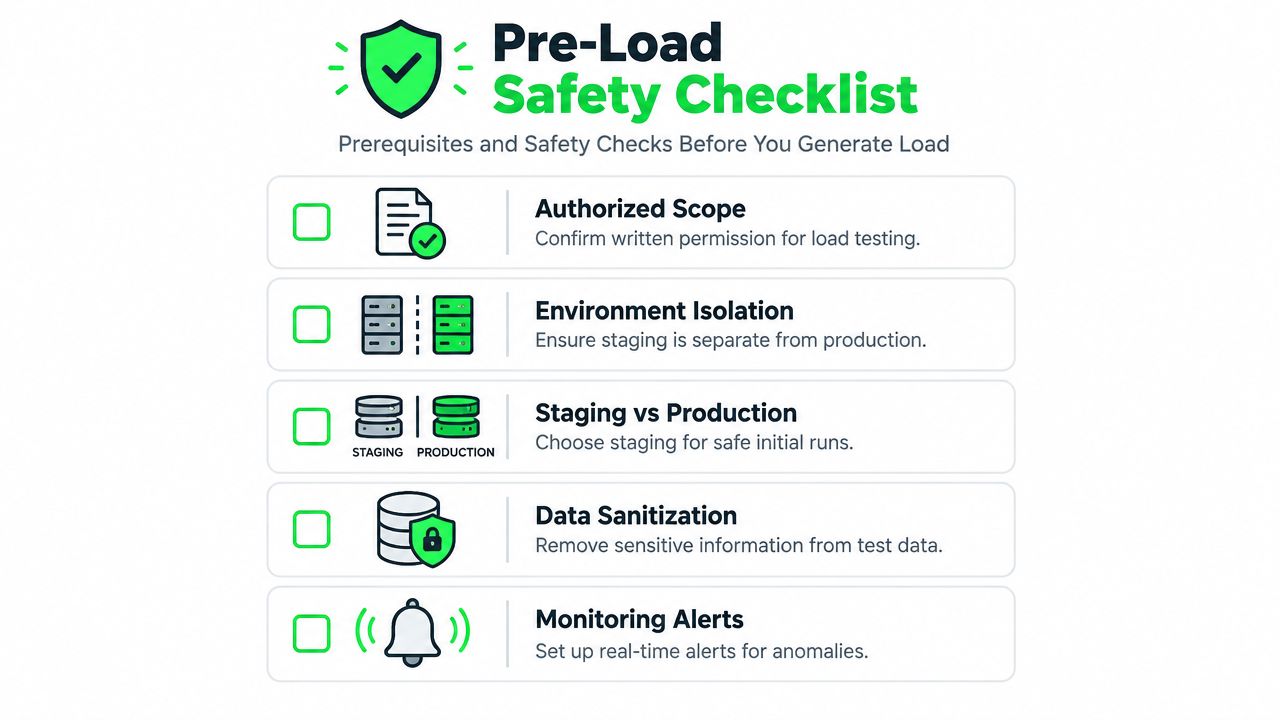
Verify the request path
Authentication deserves its own check. Use test identities with the same authorization shape as real callers, and make token refresh part of the scenario if clients refresh tokens during normal operation. Static or expired tokens can make a healthy endpoint look unavailable, while testing only unauthenticated routes removes authorization work that production performs. Guidance on OAuth2 load testing highlights both failure modes and the need to account for token refreshes, third-party calls, and throttling rather than measuring raw request capacity alone (OAuth2 API performance testing guidance).
Then map dependencies:
- Gateway and rate limiter: Record the configured behavior under and over the threshold. Confirm whether rejected requests reach the application.
- Databases and caches: Use representative data distribution and query paths. A tiny fixture can conceal contention.
- Third-party services: Stub them only when isolating application capacity. Exercise real integrations separately, with permission and quota protection.
- Queues and workers: Watch backlog, processing time, and failed jobs. A fast HTTP response can still enqueue an unsafe amount of work.
- Connection and TLS layers: Decide whether you're testing reused connections, new connections, or both.
Set the evidence before the load
Collect baseline usage first. Average RPS, peak throughput, and per-endpoint traffic distribution determine whether the scenario resembles reality or creates an artificial bottleneck, a point emphasized in Grafana's API load-testing guidance.
Define pass and fail conditions before the run, using the endpoint's SLOs. Capture request latency percentiles, throughput, concurrency, status codes, error bodies, connection behavior, and system resource use. Keep dashboards open for CPU, memory, garbage collection, worker pools, database connections, cache health, queue depth, and downstream response time.
Finally, agree on abort conditions and rollback steps. Someone should have authority to stop the test, and alerts should distinguish test traffic from customer traffic. If a run causes unexpected writes, queue growth, or dependency pressure, stop generating load before investigating the graph.
How to Run a Progressive Load Sequence That Finds the Ceiling
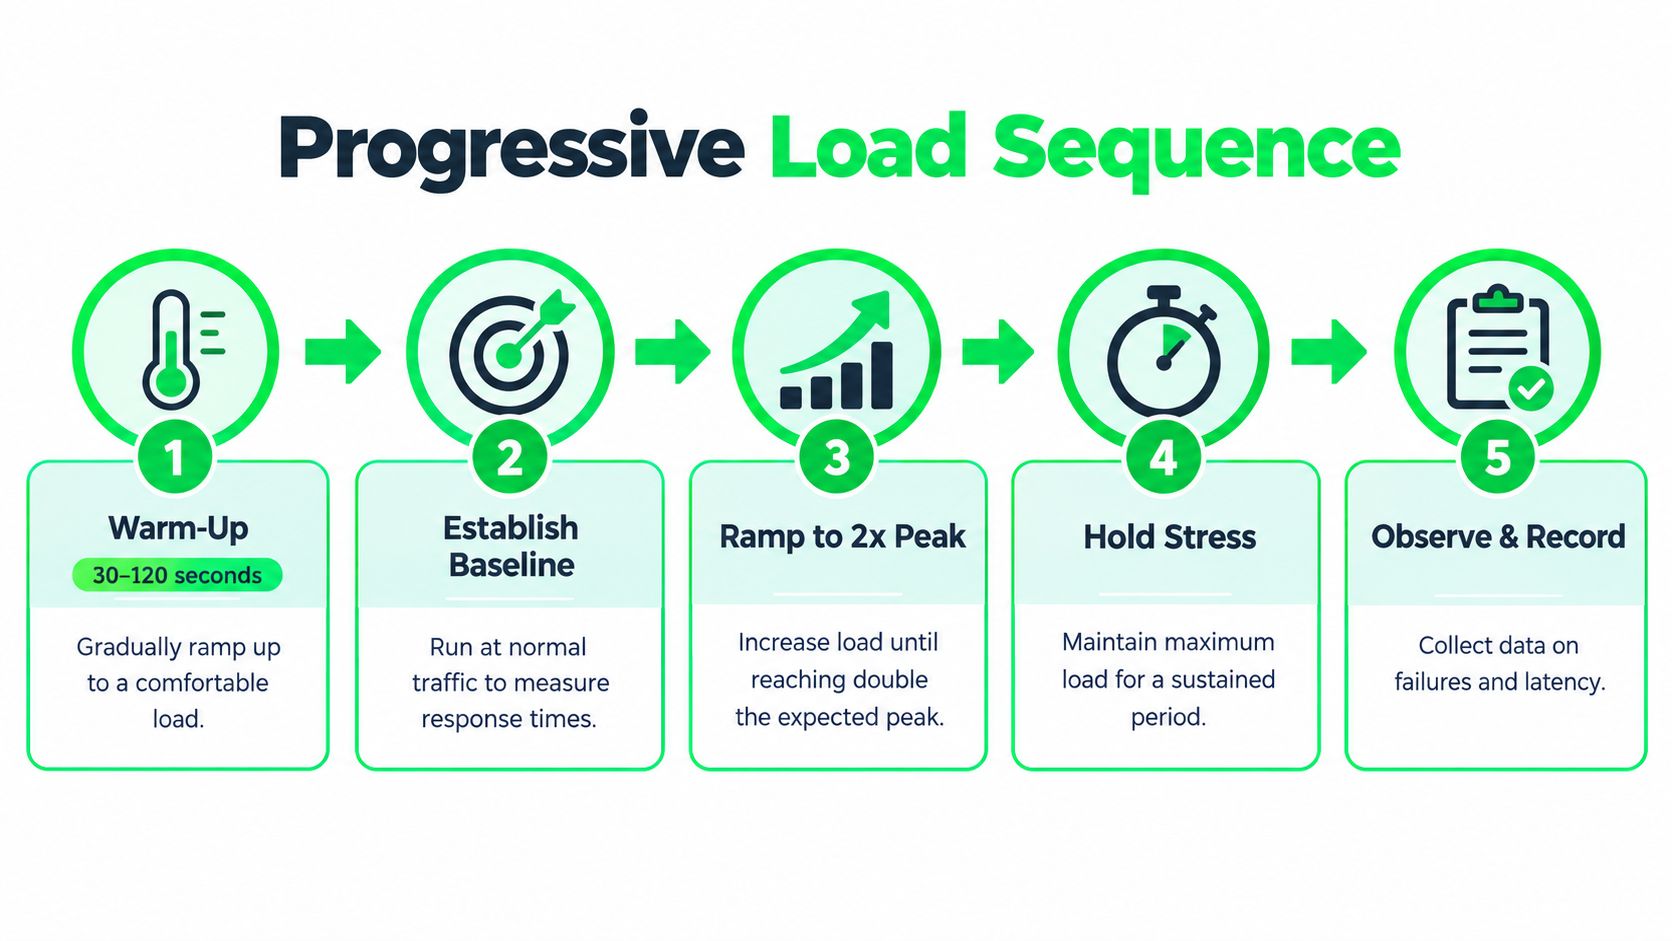
A token expires, the gateway starts returning 429 responses, and the application dashboard still shows comfortable CPU usage. That run has measured authentication or rate limiting, not endpoint capacity. A useful sequence separates those controls from application and dependency limits, then increases pressure in stages until the system's behavior changes.
Warm up and establish a baseline
Start with a gradual warm-up lasting 30 to 120 seconds. Follow it with a steady load for 5 to 15 minutes, giving latency percentiles time to settle. The API benchmarking guide recommends at least 3 trials, which lets you report median behavior and variability instead of treating one run as representative.
Warm-up exposes cold-cache effects, connection-pool creation, runtime compilation, autoscaling delays, and database page loading. Build the baseline from normal endpoint traffic rather than an arbitrary low request rate. Match the production request mix, authentication path, payload size, and connection reuse. If the test uses a single reusable token while production validates tokens or refreshes credentials, run those cases separately.
Before increasing load, validate correctness. A fast response with the wrong status code, incomplete body, stale record, or rejected token is a failed scenario. Track 401, 403, and 429 responses separately from application errors so throttling does not masquerade as a capacity limit.
Ramp toward the operating limit
Increase traffic in controlled stages until you reach 2x current peak traffic, the validation target described in the benchmarking guidance. Hold each stage long enough to observe the response rather than treating a brief spike as sustainable capacity. If rate limits reject requests before CPU, database, or downstream services approach their limits, repeat the run with approved test identities, suitable quotas, or an isolated policy.
Script the workflow around the endpoint, not around one identical request. Parameterize identifiers, authorization context, payloads, and read or write behavior. For a create-then-fetch flow, generate unique test data and clean it up safely. For a read-heavy endpoint, distribute keys according to observed traffic instead of requesting one hot object indefinitely. Include downstream calls and retries when they are part of the production path, then stub them only in a separate test designed to isolate application capacity.
Place load generators where the network path matches the question. A remote generator can make network latency look like application latency. One inside the service environment can hide edge, TLS, gateway, or rate-limit costs. For distributed tests, monitor generator CPU, bandwidth, connection limits, and clock behavior. A saturated generator produces false evidence about the API.
A packet-chain replay workflow helps when a synthetic script omits request ordering, headers, delays, or payload variation. RETRO//STRESS supports capture-to-replay chains, a web panel, REST API, and CLI interfaces, allowing a deterministic scenario to stay versioned with application code. The REST API load-testing workflow provides a reference for structuring this kind of test.
Hold, soak, and spike
After reaching the intended stress level, hold it long enough to expose gradual degradation. Short bursts can miss connection-pool exhaustion, garbage-collection pressure, queue accumulation, memory growth, and recovery failures. The practical boundary is the point where the defined error limit is crossed, or where the endpoint continues accepting work that its queues and dependencies cannot sustain, as described in this API load-testing guide.
A soak phase keeps traffic steady while you watch for drift. Compare early and late latency percentiles, resource use, open connections, queue depth, and dependency behavior. A service that slows over time has an endurance problem even when its short-run throughput appears acceptable.
Finish with a spike and recovery test. Move quickly from lower load to high load, then reduce it and observe queue drainage, error recovery, and resource return toward baseline. New requests receiving responses does not prove recovery. Check delayed work, retries, token refreshes, and downstream backlogs after the spike ends.
Run the complete sequence at least three times. Preserve the exact script, parameters, environment details, build version, and dashboards for every trial. Repeatable runs turn a stressful experiment into evidence that can be compared after code, schema, infrastructure, or dependency changes.
Metrics That Actually Define Endpoint Capacity
Capacity is a boundary across several signals, not one number. Throughput can rise while tail latency becomes unacceptable. Error rate can remain low while queue depth and memory usage show that the service is accumulating work it can't sustain.
Use percentiles to describe the user experience. p50 shows the middle request, while p95 and p99 expose the slower tail that average latency conceals. Plot those values against load and look for the knee of the latency curve, the point where additional concurrency produces disproportionate delay. That bend is often more useful than the highest successful throughput.
| Metric | What It Measures | Signal of Trouble |
|---|---|---|
| p50 latency | Typical request response time | The normal path is slowing |
| p95 latency | Slower requests near the tail | A meaningful group of callers experiences delay |
| p99 latency | Extreme tail behavior | Queueing, contention, or dependency instability is emerging |
| Requests per second | Completed request throughput | Throughput stops rising as load continues |
| Concurrency | Active work in flight | Pools, workers, or connections approach saturation |
| Error rate | Failed or rejected requests | The endpoint crosses its defined reliability boundary |
| Resource use | CPU, memory, connections, queues, and dependency pressure | A subsystem becomes the limiting factor |
These signals align with the core endpoint measures documented by Google Cloud's backend-service load testing documentation, which includes request throughput, request and connection concurrency, connection throughput, request latency, error rate, and system resource use.
Separate connections from requests
TLS-enabled APIs add another measurement problem. New connections include transport and TLS negotiation overhead that isn't part of request processing. Test both reused connections and connection creation when the production client mix warrants it, then report the distinction instead of attributing all delay to application code.
Status codes and error bodies add context to the error rate. A rise in 429 responses means something different from a rise in 5xx responses or client-side timeouts. Record which layer generated the failure, whether the request reached the handler, and whether a rejected request still consumed downstream resources.
Define the ceiling against objectives
Compare each trial with the production baseline and the endpoint's SLA or SLO targets. A capacity statement should look like a condition, such as “under this traffic shape, the endpoint stays within the agreed percentile and error boundary, and recovery completes without continuing backlog.” It shouldn't be “the service reached its maximum RPS.”
The failure threshold matters because systems often degrade before they stop responding. A rising p99, growing queue, or saturated connection pool can be the earliest actionable warning. Capture those changes, identify the first constrained component, and document whether scaling, caching, query tuning, connection changes, or backpressure addresses it.
Automating Realistic Tests and Avoiding Misleading Results
A one-off load test answers one historical question. An automated suite can detect capacity drift after a code change, schema migration, dependency update, or infrastructure adjustment. The difference comes from treating the scenario as versioned test code with explicit correctness and performance assertions.
Start with a realistic flow. Include authentication, authorization, setup, the endpoint call, response validation, and cleanup where appropriate. Parameterize user identities, tokens, payloads, resource identifiers, and timing so the test exercises the same variety that production sees. A single hardcoded request is easy to replay, but it can create cache behavior, lock patterns, and data distribution that no customer experiences.
Keep the test executable and reviewable
Store the scenario beside application code or in a repository owned by the service team. Record the environment, build identifier, test data policy, generator placement, connection behavior, and thresholds. A reviewer should be able to understand what the test proves and what it deliberately excludes.
Use assertions for both correctness and performance. A response must have the expected status and body shape, and its latency and error behavior must remain within the agreed SLO boundary. Run the suite in CI/CD at a controlled stage, then reserve heavier stress and soak runs for environments with the required isolation and observability.
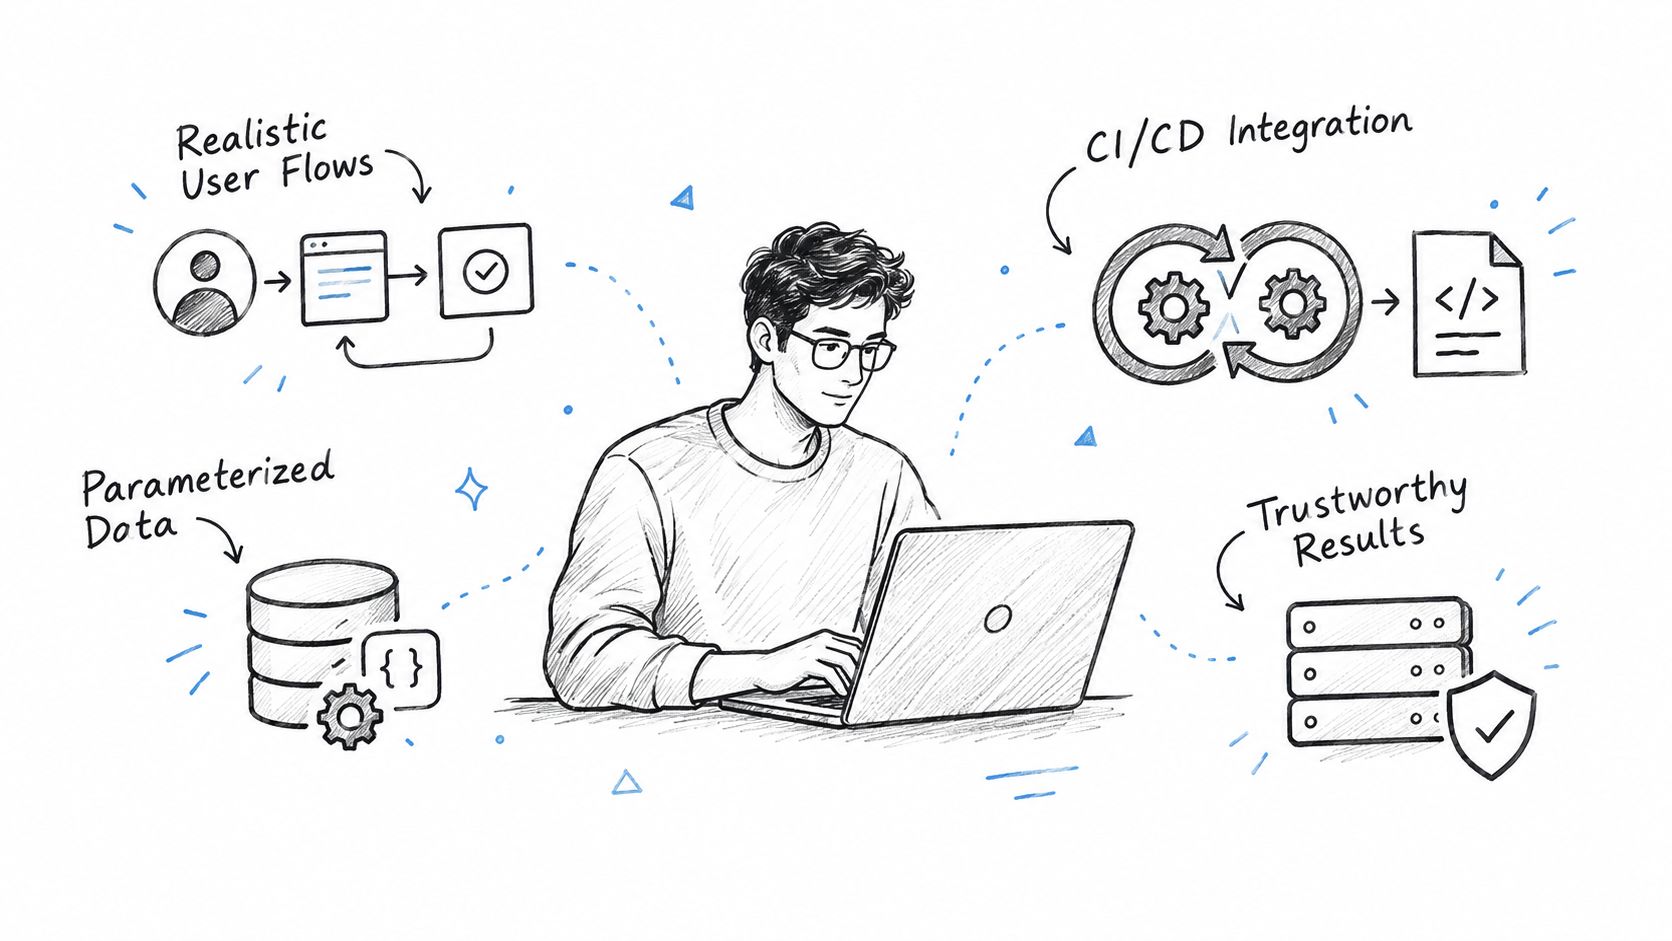
The performance testing automation guide is useful when turning a manual run into a repeatable pipeline. The tool matters less than deterministic inputs, clear thresholds, and failure artifacts that let engineers reproduce the problem.
Test the limiter as a component
Rate limits can invalidate an endpoint test in subtle ways. Distributed gateways may maintain inconsistent counters, responses may omit useful Retry-After information, rejected requests may still reach downstream services, and clients may create retry storms by immediately resending 429 responses. These are not minor reporting details. They change the load that the backend receives and can turn protection logic into the outage source.
Validate the limiter deliberately:
- Under threshold: Confirm accepted requests return the expected status and reach the intended handler.
- Over threshold: Confirm rejected requests use the expected status without consuming unnecessary downstream work.
- Across clients: Check that counters and throttling remain consistent across gateway nodes and test identities.
- Response guidance: Verify that rate-limit headers and
Retry-Aftervalues give clients usable backoff information. - Recovery: Stop or reduce generated traffic and observe whether the limiter and backend return to stable behavior.
- Retry behavior: Use a client policy that respects rejection signals, then run a separate test for poorly behaved retries if that failure mode matters.
A trustworthy regression suite therefore tests the endpoint, its admission controls, and the dependencies that carry accepted work. Otherwise, the report may accurately describe the load generator while saying very little about the service.
Your Next Test and How to Keep Results Reliable
A useful next run starts with a decision: can this endpoint meet its objective under expected pressure, and what fails first? Before generating traffic, confirm authorization, isolation, credentials, test data, dependency scope, dashboards, abort conditions, and rollback ownership. Include authentication and downstream calls in the plan, or token failures and dependency limits can masquerade as endpoint capacity.
Keep the sequence consistent:
- Warm up: Let cold-start effects settle before recording results.
- Hold steady: Run each measured stage long enough to expose stable percentiles and drift.
- Repeat trials: Run at least 3 trials when median behavior and variability need a defensible comparison, following the benchmarking methodology.
- Review the boundary: Record the error-rate threshold and latency curve where the service stops meeting its objective. Separate gateway throttling, expired tokens, and downstream failures from handler saturation.
- Re-test periodically: Repeat tests as data volume, dependencies, traffic shape, or infrastructure changes. Endpoint ceilings can drift as data grows, so schedule recurring checks, including quarterly reviews where appropriate, consistent with API load-testing duration guidance.
Store capture-to-replay scenarios and .chain v1.3 files in git when packet-level fidelity matters. The durable result is a repeatable artifact, not a capacity claim that cannot be reproduced.
RETRO//STRESS provides authorized Layer 4 and Layer 7 testing, capture-to-replay packet chains, plus web panel, REST API, and CLI controls. Visit RETRO//STRESS to build controlled tests covering authentication, rate-limit behavior, and downstream pressure.