The most popular advice about network performance testing tools is also the most misleading: pick one familiar load generator and use it for everything. A throughput test won't tell you whether packet timing breaks a game session. A packet replay won't validate an HTTP checkout journey. A browser test won't isolate link capacity, jitter, or device behavior.
Start with the failure mode. Link throughput and jitter need endpoint measurements. Packet-level replay needs captured traffic and timing control. HTTP or gRPC load needs protocol-aware scenarios, assertions, and rate models. Browser journeys need real navigation and interaction. Distributed testing adds geography, worker coordination, provider limits, and cost control.
The comparison below weighs each tool against the work it performs, including workload realism, protocol coverage, automation, scale, observability, authoring effort, and operational limits. Teams also need network expertise to interpret results correctly, especially when an application symptom comes from routing, middleboxes, or congestion. If you're building that capability, network engineer recruitment for IT teams can help you find people who can connect test design with production diagnosis.
Run every test only against infrastructure you own or are explicitly authorized to assess. Define scope, coordinate with cloud and network providers, notify monitoring and protection teams, establish safe limits, and keep the generator, target, and recovery process under observation.
Table of Contents
- 1. RETRO//STRESS
- 2. iPerf3
- 3. Apache JMeter
- 4. Grafana k6
- 5. Gatling
- 6. Locust
- 7. Artillery
- 8. Fortio
- 9. Vegeta
- 10. Tcpreplay
- Top 10 Network Performance Testing Tools, Comparison
- Match the Tool to the Failure Mode
1. RETRO//STRESS
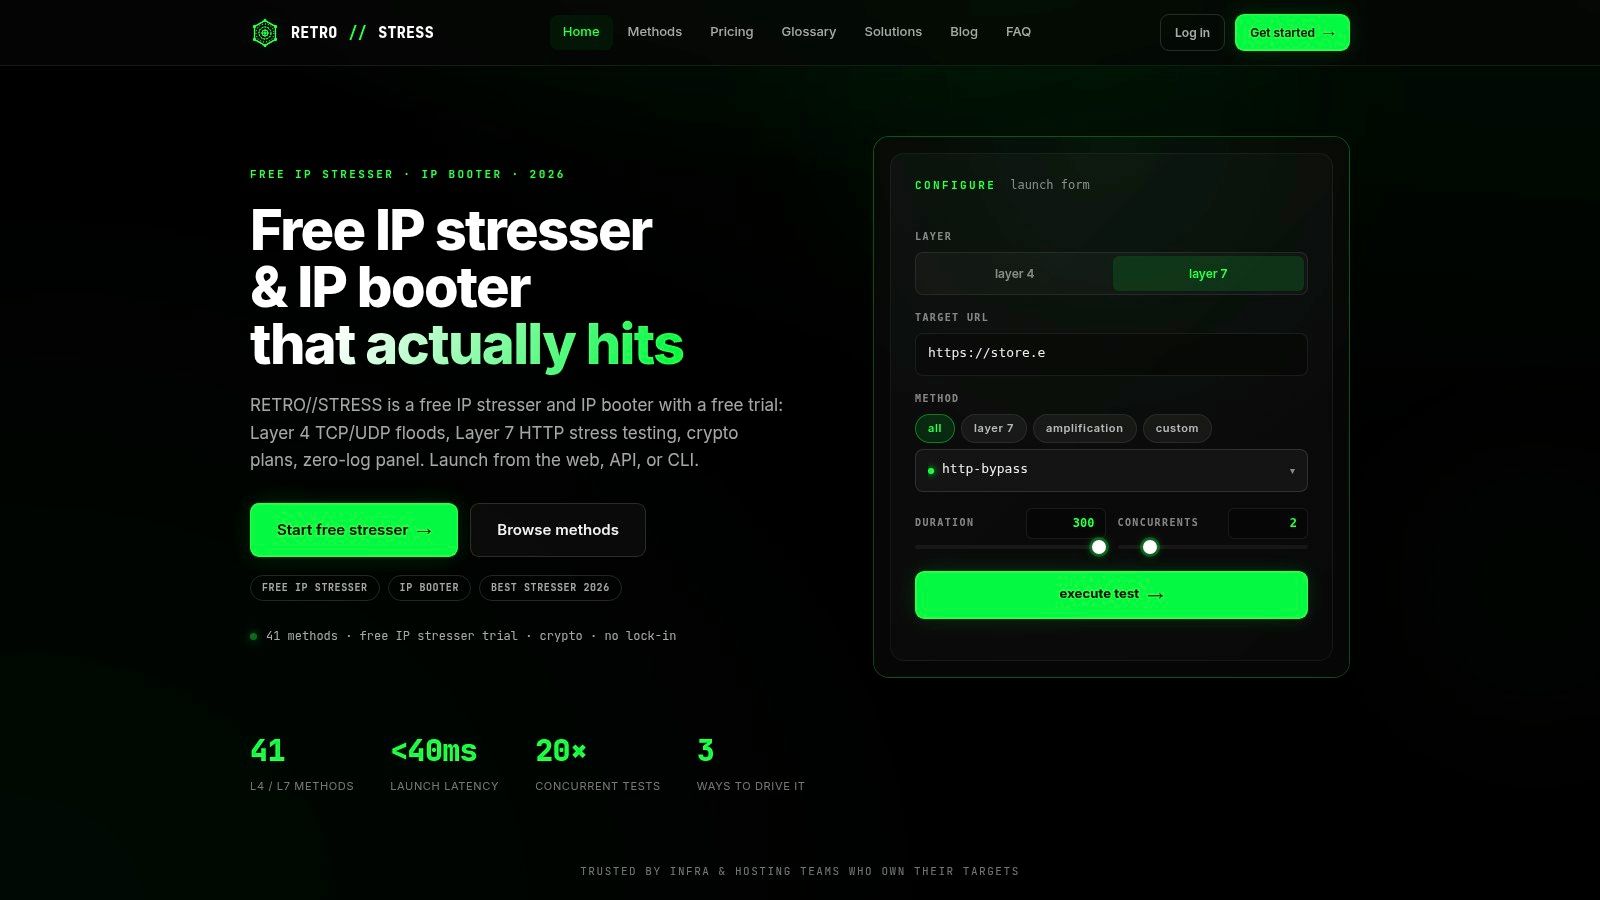
RETRO//STRESS is the strongest fit when the question is not “how much traffic can this endpoint handle?” but “can we reproduce the traffic pattern that caused the failure, validate the mitigation, and keep that test for the next release?”
The platform supports 41 documented Layer 4 and Layer 7 methods, covering TCP, UDP, ICMP, HTTP, and HTTPS. Its deterministic packet-chain model, based on the open .chain v1.3 format, lets engineers capture traffic from desktop, CLI, or mobile clients, import PCAP data, export chains, and replay the resulting sequence as a versioned test artifact.
Where it works best
The practical advantage is control below the level of a typical slider-based load tool. A chain can preserve per-step payloads, delays, flags, and selected SEQ, timestamp, and IPID overrides. That makes it useful for DDoS scrubbing validation, middlebox testing, game-server traffic, fintech protocols, and incident regression testing.
The same engine is available through a point-and-click web panel, a token-authenticated REST API with JSON input and output, and a CLI. Teams can run a manual test, schedule timezone-aware validation, or place an authorized resilience gate in CI/CD without maintaining separate test logic for each interface.
Practical rule: If an incident produced a representative capture, preserve the sanitized capture and turn it into a repeatable regression artifact instead of describing the traffic from memory.
The platform also emphasizes governance through authorized-use enforcement, audit logging, bearer-token authentication, Argon2id password hashing, and a zero-log design. Distributed workers support geographically realistic generation, while configurable concurrency and duration plans provide operational flexibility. The trade-off is complexity. Engineers unfamiliar with packet composition and .chain files will need time to learn the model, and public pricing details aren't listed. Visit the RETRO//STRESS getting started documentation before designing a first test.
Best for: forensic packet replay, Layer 4 and Layer 7 resilience validation, controlled global traffic, and incident-driven CI/CD regression.
Website: RETRO//STRESS
2. iPerf3
iPerf3 answers a narrow question very well: what happens between two endpoints when you generate TCP or UDP traffic under defined test conditions?
It remains a practical default for link-capacity validation, path troubleshooting, and tuning. You run a server at one endpoint and a client at the other, then vary duration, parallel streams, transport settings, and UDP parameters. TCP results help reveal achievable throughput and transport behavior. UDP testing adds packet loss and jitter observations that a basic bandwidth test won't expose.
The tool's design is deliberately modest. It runs from the command line, produces JSON output for automation, and has cross-platform builds. That makes it easy to place in scheduled checks, infrastructure validation, or a pipeline that compares endpoint behavior against an agreed threshold.
The historical context is useful. A University of Wisconsin–Madison survey places iperf among the network utilities associated with the 1999 generation, alongside hping2, MTR, Nmap, and NetFlow, and lists 20 tools in 1999 compared with 29 in 2000. The survey illustrates how quickly network measurement software expanded during that period, rather than proving a current performance result. See the University of Wisconsin–Madison network monitoring survey for that historical record.
iPerf3 measures the path and transport behavior. It doesn't tell you whether a user can complete a business transaction.
Don't confuse it with an application load generator. iPerf3 won't model an HTTP login, a gRPC retry policy, a browser-rendered page, or a multi-step API journey. It also isn't backward-compatible with iperf2, so mixed environments require deliberate version and feature checks. For a useful contrast between transport tests and protocol-specific fault discovery, see TCP, UDP, and ICMP testing that finds real faults.
Best for: endpoint throughput, UDP jitter, path validation, and lightweight automated checks.
3. Apache JMeter
Apache JMeter is the practical choice when a test needs a multi-step protocol plan rather than a single request stream. QA and SRE teams use its GUI to assemble thread groups, requests, assertions, parameterization, and listeners, then run the same plan headlessly from a pipeline.
Its coverage extends across HTTP(S), TCP, JMS, JDBC, and other protocol-oriented workloads. That breadth matters when the system under test combines a web API with messaging or database interactions. You can model authentication, extract a value from one response, pass it into the next request, and assert both protocol behavior and returned content.
JMeter's ecosystem is its biggest advantage. Existing examples, plugins, and community guidance reduce the effort needed to build familiar scenarios. The GUI also helps teams inspect a plan during authoring, although the GUI isn't the right place to generate serious scale. Headless execution, distributed configuration, and external result collection need more discipline.
The trade-off in practice
JMeter consumes more resources and demands more design care than a minimalist CLI tool. Poorly modeled thread groups, excessive listeners, or an unrealistic data strategy can make the generator the bottleneck. A test can appear to show target degradation when the load workers are starved.
Use JMeter when protocol breadth and scenario composition outweigh simplicity. Use iPerf3, Vegeta, or Fortio when the question is narrower and a scripted plan would add unnecessary maintenance. JMeter is also a reasonable bridge for teams moving from manual QA into repeatable performance testing, provided they treat test plans as maintained engineering assets rather than disposable GUI files.
Best for: complex HTTP workflows, mixed protocol plans, database or messaging paths, and teams that benefit from a mature plugin ecosystem.
4. Grafana k6
Grafana k6 is built around a code-first workflow. Engineers write JavaScript scenarios, add checks and thresholds, run them locally, and place pass or fail conditions directly in CI/CD. That makes k6 feel closer to application code than to a traditional test-plan editor.
The model suits API and microservice testing particularly well. A script can generate a workload, validate status and response content, tag requests, and apply thresholds to latency or error behavior. The resulting test is readable in version control and easier to review than a large opaque configuration file.
k6 can run with its open-source local runner or with Grafana Cloud k6 for managed distributed execution. Grafana integration is the important operational draw. Teams already using Grafana dashboards and related observability tooling can correlate test output with service, infrastructure, and application signals instead of reading the load result in isolation.
That convenience has limits. Managed execution is billed by virtual-user hours, and the cost depends on the shape of the test. Browser-level capabilities and free-plan limits also vary by account and tier, so teams should verify current terms before treating browser checks as a complete replacement for dedicated journey testing.
A good k6 boundary
Use k6 for repeatable API behavior, service thresholds, and developer-owned performance tests. Don't use it as a substitute for packet replay when the failure depends on exact wire behavior, or as a substitute for full browser coverage when rendering and user interaction are the subject of the test.
Best for: tests-as-code, API and microservice gates, Grafana-centered observability, and CI/CD workflows.
5. Gatling
Gatling suits teams that want high-scale load scenarios expressed as code and maintained like software. Its engine runs on the JVM, while authoring can use Scala, Java, JavaScript, or TypeScript. The scenario DSL is expressive enough for chained requests, feeders, checks, pauses, and conditional behavior.
The open-source edition is useful for local execution and pipeline integration. Gatling's Enterprise edition adds distributed orchestration, live reporting, team workflows, SSO, and role-based access controls. Those additions matter when performance testing moves from an individual engineer's repository into a governed program with shared environments and approval boundaries.
The engine is efficient, but the authoring experience still depends on team skills. JVM and DSL knowledge helps when scenarios become complex. Teams that only need a few endpoint checks may find Gatling heavier than k6 or Vegeta, while organizations with existing JVM expertise can benefit from fitting performance tests into established build and code-review practices.
Choose it for durable test engineering
Gatling works particularly well for organizations that run recurring release validation and need a strong separation between scenario code, execution infrastructure, and reporting. Enterprise integrations can connect results with application performance monitoring systems and delivery workflows, but some collaboration and distributed capabilities aren't present in the open-source edition.
It isn't a packet tool, a browser-first tool, or a link-measurement tool. Its strength is disciplined, efficient application workload modeling.
Best for: code-driven HTTP testing, JVM-oriented teams, scalable CI/CD execution, and governed collaboration.
6. Locust
Locust makes workload behavior feel familiar to Python teams. User flows are written in Python, so engineers can use normal control flow, data structures, helper functions, fixtures, and libraries instead of learning a proprietary scenario language.
That flexibility is useful for irregular business behavior. A simulated user can select data, branch on a response, pause according to a model, or call shared application helpers. Locust also supports distributed execution across workers, with a web interface for starting and stopping tests and reviewing basic metrics.
The main boundary is protocol focus. Locust is primarily oriented toward HTTP, and non-HTTP behavior needs additional work or custom client code. That isn't necessarily a problem, but it changes the ownership cost. A Python team can move quickly for web APIs, while a team testing raw UDP, packet timing, or a specialized binary protocol should choose a tool designed for that layer.
Reporting is simpler than the reporting found in some commercial platforms. Engineers commonly export or aggregate results into their existing metrics and dashboard systems. Locust Cloud provides hosted execution and support for teams that don't want to operate the workers themselves.
Where Python pays off
Locust is a strong fit when test logic is the difficult part. It gives developers room to model reusable behavior without forcing every scenario into a fixed recorder or GUI. It isn't the best fit when the primary requirement is deep built-in analytics, browser realism, or precise packet-level replay.
Best for: Python-based teams, customized HTTP behavior, reusable fixtures, and horizontally distributed web workloads.
7. Artillery
Artillery covers a useful middle ground between simple API load and full end-to-end journey testing. It supports HTTP, WebSocket, Socket.io, gRPC, and browser scenarios built with Playwright. That protocol range makes it relevant to modern web systems with real-time connections and service APIs.
Authoring can use YAML for readable workload definitions and JavaScript for more advanced logic. The browser capability matters when a team needs to connect backend pressure with a real user path, although browser tests have different resource and scaling characteristics from protocol-level virtual users. Treating both as the same workload will produce confusing results.
Artillery Cloud offers managed execution on AWS backends, centralized results, and team reporting. That removes much of the infrastructure work involved in distributed runs. It also introduces commercial boundaries. Advanced insights and reporting require an Artillery Cloud subscription, and some cloud or Azure modules use different licenses, so procurement and deployment plans should include a review of the applicable terms.
Protocol breadth versus cost
Artillery is attractive when one tool needs to cover HTTP APIs, WebSockets, gRPC, and selected Playwright journeys. It won't replace packet replay for middleboxes or DDoS mitigation, and it won't give a pure link-capacity answer. Its value comes from connecting modern application protocols with a managed execution path.
Best for: real-time web applications, gRPC services, browser-assisted journeys, and cloud-based distributed tests.
8. Fortio
Fortio is small, fast, and particularly useful in Kubernetes and service-mesh environments. It generates HTTP or HTTPS and gRPC traffic using a QPS-oriented model, reports latency histograms and SLO percentiles, and includes both an echo server and a web interface.
The built-in server is more than a convenience. It gives engineers a controlled endpoint for connectivity checks, mesh routing tests, and debugging harnesses. Running Fortio in containers makes it easy to place a client and server around an Istio or other service-mesh path, then inspect how routing, retries, timeouts, and policies affect behavior.
Fortio's rate model is useful for steady service checks, but its scope is intentionally narrow. It doesn't replay TCP or UDP packets, reconstruct a browser journey, or provide the higher-level workflow management found in larger load platforms. Engineers need external observability if they want deep traces, resource correlation, or long-term result management.
The service-mesh use case
Use Fortio when the system boundary is a service endpoint and the question concerns latency, errors, routing, or SLO behavior. It pairs well with mesh telemetry because the generator can stay lightweight while Prometheus, Grafana, tracing, and sidecar metrics provide the surrounding explanation.
Don't choose it for a raw network resilience exercise. Fortio validates application protocols, not packet-level behavior.
Best for: HTTP and gRPC service checks, Kubernetes harnesses, service-mesh routing, and lightweight latency analysis.
9. Vegeta
Vegeta is built around one idea: generate HTTP requests at a controlled constant rate for a defined duration. That simplicity makes it valuable for capacity studies where request-rate determinism matters more than modeling a large population of different user journeys.
You provide targets, set the attack rate and duration, collect results, then generate text, JSON, binary, or HTML reports and plots. The Go library can also be embedded into other tests or internal tools, which gives platform teams a way to standardize a rate-controlled workload without adopting a complete performance platform.
The limitation is equally clear. Vegeta is HTTP-only. It doesn't simulate browsers, WebSockets, gRPC, TCP, UDP, or packet replay. It also has minimal built-in dashboarding, so teams usually send output into external systems such as Prometheus and Grafana when they need historical comparison or correlation with service telemetry.
Why constant rate matters
Many tests accidentally allow request production to rise and fall with response speed. A constant-rate generator gives a cleaner capacity question: how does the service behave while the intended request rate remains fixed? That can expose queueing, error growth, and latency changes without the generator adapting to the target's slowdown.
Best for: deterministic HTTP rates, reproducible command-line tests, capacity experiments, and Go-based integration.
10. Tcpreplay
Tcpreplay is for engineers who need to replay captured packets rather than invent an abstract user model. It edits and replays PCAP traces at controlled speeds, provides flow statistics, and includes utilities such as tcprewrite for adapting addresses and other trace details to the authorized test environment.
That makes it useful for validating firewalls, intrusion detection systems, NetFlow or IPFIX collectors, DDoS protection, ACLs, and other middleboxes. A representative capture preserves traffic relationships and protocol details that a generic request generator may omit. Replay paths such as XDP and netmap can help teams pursue high-throughput injection where the test host and network path are designed for it.
Preparation is the hard part. Captures must be representative, sanitized, legally usable, and compatible with the target topology. Address rewriting, interface selection, timing, VLAN behavior, asymmetric paths, and stateful device expectations all need review. A PCAP is not a browser script, and replaying packets doesn't prove that an application completed a user journey.
Packet realism is valuable only when the capture represents an authorized scenario and the replay environment preserves the behavior you intend to measure.
Tcpreplay complements, rather than replaces, Layer 7 tools. Pair it with application tests when you need both middlebox evidence and transaction-level outcomes. For a focused operational treatment, see PCAP replay load testing.
Best for: packet realism, appliance validation, incident traffic replay, and network-layer or device testing.
Website: Tcpreplay
Top 10 Network Performance Testing Tools, Comparison
| Tool | Core features | UX & quality (★) | Price / Value (💰) | Target audience & USP (👥 / ✨) |
|---|---|---|---|---|
| 🏆 RETRO//STRESS | L4/L7 (41 methods); .chain v1.3 packet‑chains; capture clients (desktop/CLI/mobile/PCAP); REST API/CLI; global workers | ★★★★★ deterministic, forensic replay & live monitoring | 💰 Guest→Starter→Elite→Enterprise; configurable concurrency/duration; contract‑free; crypto payments | 👥 SREs, network engineers, red teams; ✨ capture‑to‑replay, versionable .chain, per‑step packet control, privacy‑first, audit logs |
| iPerf3 (ESnet) | TCP/UDP throughput tests; parallel streams; server/client mode; JSON output | ★★★★ lightweight, automation‑friendly | 💰 Free OSS; easy CI integration | 👥 Network engineers, R&E; ✨ simple, standardized throughput and JSON reporting |
| Apache JMeter | HTTP(S), TCP, JMS, JDBC; thread groups & assertions; plugin ecosystem | ★★★★ mature GUI + headless CI | 💰 Free OSS; broad plugin support | 👥 QA, SREs; ✨ rich protocol coverage, GUI for complex test plans |
| Grafana k6 | JS tests-as-code; local OSS runner + Grafana Cloud; thresholds/checks | ★★★★ developer‑centric, observability integration | 💰 OSS + Grafana Cloud (v‑user hours billing) | 👥 Devs, SREs; ✨ JS scripting, tight Grafana dashboards & CI gates |
| Gatling | Code DSL (Scala/Java/JS/TS); efficient JVM engine; Enterprise orchestration | ★★★★ high‑scale performance | 💰 OSS + paid Enterprise for orchestration & reporting | 👥 Performance engineers; ✨ efficient engine, Enterprise live reporting & governance |
| Locust | Python scenarios; horizontal scaling; simple web UI | ★★★ developer‑friendly, scriptable | 💰 Free OSS; Locust Cloud option | 👥 Python devs, SREs; ✨ easy Python authoring, scales to many workers |
| Artillery | Node.js YAML/JS tests; WebSocket/gRPC/Playwright; cloud execution | ★★★★ modern workload modeling | 💰 OSS + Artillery Cloud for managed runs | 👥 Web/backend devs; ✨ browser-level Playwright, serverless cloud scale |
| Fortio | Go-based HTTP/gRPC; QPS-driven; built-in echo server & UI | ★★★★ very fast, lightweight | 💰 Free OSS; easy container/K8s use | 👥 Service‑mesh & infra teams; ✨ client+server primitives, SLO percentiles |
| Vegeta | Rate‑limited HTTP attacks; multiple output formats; Go library | ★★★ deterministic RPS modeling | 💰 Free OSS; library embed friendly | 👥 Devs doing capacity studies; ✨ deterministic RPS, embeddable in Go |
| Tcpreplay | PCAP editing & replay at line‑rate; tcprewrite tools; timing control | ★★★★ packet‑level realism for appliances | 💰 Free OSS; complements L7 testers | 👥 Network engineers, appliance testers; ✨ true PCAP replay for DDoS/middlebox validation |
Match the Tool to the Failure Mode
Choose the tool from the failure you need to explain, not from the tool that happens to be most familiar to the team.
For endpoint throughput and jitter, start with iPerf3. It gives you a clean client-to-server measurement for TCP and UDP behavior, which is the right foundation for checking a link or path. It won't explain an application timeout by itself, so pair the result with service telemetry and, when relevant, an application-level test.
For packet realism and incident replay, choose Tcpreplay or RETRO//STRESS. Tcpreplay is a strong fit when you already have a prepared PCAP and need to exercise an appliance, collector, firewall, or mitigation layer. RETRO//STRESS is better when you want capture-to-replay workflows, deterministic .chain artifacts, Layer 4 and Layer 7 methods, distributed workers, and the same test engine available through a web panel, API, and CLI.
For scripted application workloads, JMeter, k6, Gatling, Locust, and Artillery cover different engineering preferences. JMeter offers broad protocol coverage and a mature GUI. k6 fits JavaScript tests-as-code and Grafana workflows. Gatling favors efficient code-driven scenarios and governed enterprise execution. Locust is a natural choice for Python teams with complex user logic. Artillery is compelling when HTTP, WebSockets, Socket.io, gRPC, and Playwright journeys need to coexist.
For service-mesh HTTP and gRPC checks, Fortio keeps the generator lightweight and gives you QPS control, latency histograms, an echo server, and a container-friendly deployment model. For controlled HTTP rates, Vegeta is the cleaner choice when constant-rate behavior and reproducible reports matter more than browser or protocol breadth.
The strongest resilience programs combine tools. A link test can establish transport behavior, packet replay can exercise middleboxes, an application generator can expose transaction latency, and observability can connect those results to services, hosts, meshes, and mitigation systems. That layered approach matters as environments become more distributed and cloud-heavy. Cloud-based performance testing captured 51.55% of market share in 2025, while hybrid deployments are projected to grow at a 15.68% CAGR through 2031, according to Mordor Intelligence's performance testing tools market analysis. Those figures point to a deployment preference, not a reason to move every test into the cloud. Cost controls, regional workers, provider coordination, and data handling still determine whether a distributed test is useful.
Usability also affects adoption. A Globalping user study reported a 65.62 SUS score versus 42.38 for RIPE Atlas, based on 40 users with mixed backgrounds, as described in the network performance testing tools market report. The practical lesson is simple: a technically capable tool that teams avoid during incidents won't protect the system. Favor interfaces and workflows that let the people responsible for SRE, DevOps, support, and network operations run the right test without unnecessary cognitive overhead.
Modern testing also needs to move beyond Mbps. Current market analysis highlights demand for deterministic, protocol-aware validation across 5G, private networks, Open RAN, and application-layer AI responsiveness, including measures such as time-to-first-token. DataHorizzon Research's network test and measurement analysis describes that shift. Teams should define whether they are testing packet delivery, protocol conformance, service latency, user journeys, or application responsiveness before selecting a generator.
Start each implementation with a measurable hypothesis. Define safe limits and abort conditions, run from approved locations, instrument both the generator and the system under test, and compare results against explicit thresholds. Preserve scripts, sanitized PCAPs, .chain files, configurations, environment details, and dashboards so the next run can reproduce the same question. For distributed systems, also document geographic assumptions and edge placement, because edge computing latency drivers can change the path between a user, service, and test worker.
RETRO//STRESS provides authorized Layer 4 and Layer 7 testing, deterministic packet-chain capture and replay, and web, REST API, and CLI access for repeatable automation. Visit RETRO//STRESS to evaluate whether its incident-replay and resilience workflows fit your network performance testing program.