A feature merges late on Friday. By Monday morning, customers are abandoning carts, support is reporting timeouts, and the on-call engineer is comparing database plans with a production trace. Unit tests passed. Integration tests passed. Staging looked healthy. The regression appeared only when a realistic mix of requests drove the new query plan into the tail of the latency distribution.
That failure pattern is common because many teams still treat performance testing as a release ceremony. Someone runs a large load test before a major launch, reviews a dashboard, and moves on. The majority of commits receive no performance signal at all.
CI/CD performance testing works differently. A performance test becomes part of the delivery system, with a versioned workload, machine-readable results, environment metadata, and a decision that the pipeline can enforce. The test doesn't need to be large on every change, but it does need to be repeatable and connected to a clear service-level objective.
Table of Contents
- When Performance Tests Become Pipeline Citizens
- Choosing the Right Test Type for Each Pipeline Stage
- Turning Real Traffic into Replayable Workloads
- Metrics That Catch Regressions Before Customers Do
- Wiring Performance Tests into Your CI CD Pipeline
- Building Pass and Fail Gates You Can Defend
- Troubleshooting Noisy and Flaky Performance Results
When Performance Tests Become Pipeline Citizens
The checkout team in the opening scenario had plenty of tests. What it lacked was a test that exercised the changed database path under representative concurrency before the code reached customers. Its staging environment provided a place to deploy, not evidence that the service would maintain acceptable tail latency when sessions competed for the same resources.
That distinction matters. A manually launched load test can find serious problems, but it creates a wide measurement gap between releases. A developer can change a query, connection pool, serializer, cache policy, or network path without triggering any performance validation. By the time the next scheduled test runs, several changes may be entangled.
A pipeline citizen has four properties:
- Automatic execution: The test is tied to a pull request, merge, deployment, schedule, or risk signal rather than an individual remembering to launch it.
- Versioned input: The script, request chain, test data assumptions, rate profile, and pass criteria are stored with the application or its delivery configuration.
- Machine-readable output: The job publishes latency percentiles, throughput, errors, resource telemetry, and the exact commit and environment used.
- An explicit decision: The pipeline can block, warn, or approve based on SLO conformance and measured regression.
Practical rule: A performance test that can't be reproduced from its stored inputs is an observation, not a regression test.
The outcome layer should connect individual benchmarks to delivery stability. The 2024 DORA report describes deployment frequency, lead time for changes, change-failure rate, failed-deployment recovery time, reliability, and deployment rework rate as related indicators of software delivery. DORA's underlying research spans more than 32,000 technology professionals and organizations, so it provides a useful operating frame rather than a narrow benchmark score.
The practical objective isn't to make every pull request run a production-sized test. It's to make performance evidence arrive at the same time as code evidence. Lightweight checks protect feedback speed, representative load validates release candidates, and resilience tests expose failure behavior on a controlled cadence.
Choosing the Right Test Type for Each Pipeline Stage
Full load profiles on every commit sound rigorous until developers start waiting for them, shared runners compete with injectors, and noisy results cause teams to retry jobs instead of trusting them. The useful question is not whether testing is continuous. It's which test answers the risk of a particular change at an acceptable cost.
Use a three-tier test portfolio
Tier one, smoke performance. Run a small, deterministic profile for every relevant change. It should exercise the highest-value endpoints at controlled concurrency and verify basic latency, error, and response-size expectations. This job belongs in the per-change path because it provides an early signal without attempting to prove maximum capacity.
Tier two, steady-state load. Run a representative workload after merge, before a staging deployment, or as part of a release candidate. The workload should preserve realistic endpoint ratios, parameter variation, session timing, and expected sustained pressure. This tier answers whether the build behaves like the service customers use.
Tier three, endurance and resilience. Run longer soak, burst, or failure-oriented tests on a schedule or after a risk-significant infrastructure change. These tests are designed to expose memory growth, connection exhaustion, queue buildup, autoscaling mistakes, and recovery problems. They shouldn't sit in the critical path for every developer change.
The same scenario can often serve all three tiers if runtime parameters control rate, concurrency, duration, and region. That preserves comparability while avoiding the false choice between a fast pipeline and realistic evidence. A short test isn't automatically useful, and a long test isn't automatically trustworthy. Both depend on controlled infrastructure and a representative workload.
| Tier | Pipeline Trigger | Duration | Concurrency | What It Catches |
|---|---|---|---|---|
| Smoke | Every relevant change or merge request | Short and fixed | Low and controlled | Obvious latency, error, routing, and serialization regressions |
| Steady-state | Merge, staging deployment, or release candidate | Representative window | Expected service load | Throughput loss, tail-latency growth, saturation, and endpoint imbalance |
| Endurance or resilience | Scheduled run or high-risk change | Extended and repeatable | Elevated or failure-oriented | Leaks, pool exhaustion, queue growth, recovery defects, and capacity limits |
Tool choice should follow the protocol and evidence needed. k6, JMeter, and Gatling can handle HTTP-oriented scenarios, while protocol-specific or packet-level workloads may require a different generator. Whatever tool you choose, size the load generator separately from the system under test. An overloaded injector produces a test of the injector, not the application.
A useful CI policy is simple: fast deterministic checks block early, realistic load gates promotion, and expensive resilience tests produce scheduled evidence. Teams that put every test on the merge path eventually create incentives to bypass the whole system.
Turning Real Traffic into Replayable Workloads
Synthetic traffic is valuable for controlled experiments, but it often smooths away the request shapes that cause production contention. Real systems receive unusual parameter combinations, session gaps, header variations, payload sizes, retries, and endpoint sequences. Those details can determine whether a change is safe.
Start with an authorized capture point, such as an ingress log, service-mesh telemetry, application recorder, or protocol capture client. Sample representative flows, then remove personal data, credentials, tokens, and customer-controlled secrets before the material leaves the production boundary. Sanitization must preserve the behavior that affects performance, including parameter cardinality, payload structure, header combinations, and session ordering.
Store the workload as code
Convert the sanitized capture into a replay artifact. For HTTP APIs, that might be a request-chain or HAR-style representation. For gRPC, database, or lower-level protocols, use a session or packet-chain format that retains ordering, payloads, delays, and protocol-specific state.
The artifact should answer these questions without relying on tribal knowledge:
- Which service and endpoints does it exercise?
- Which fields are fixed, generated, or drawn from seeded data?
- What delays and dependencies occur between requests?
- Which values must be unique for a stateful operation?
- Which rate, concurrency, duration, and region parameters can the runner override?
- Which response conditions count as failure?
Commit the sanitized workload beside the application or in a clearly versioned performance repository. Review it like code. A change to the workload can alter the meaning of a benchmark just as surely as a change to the application can.
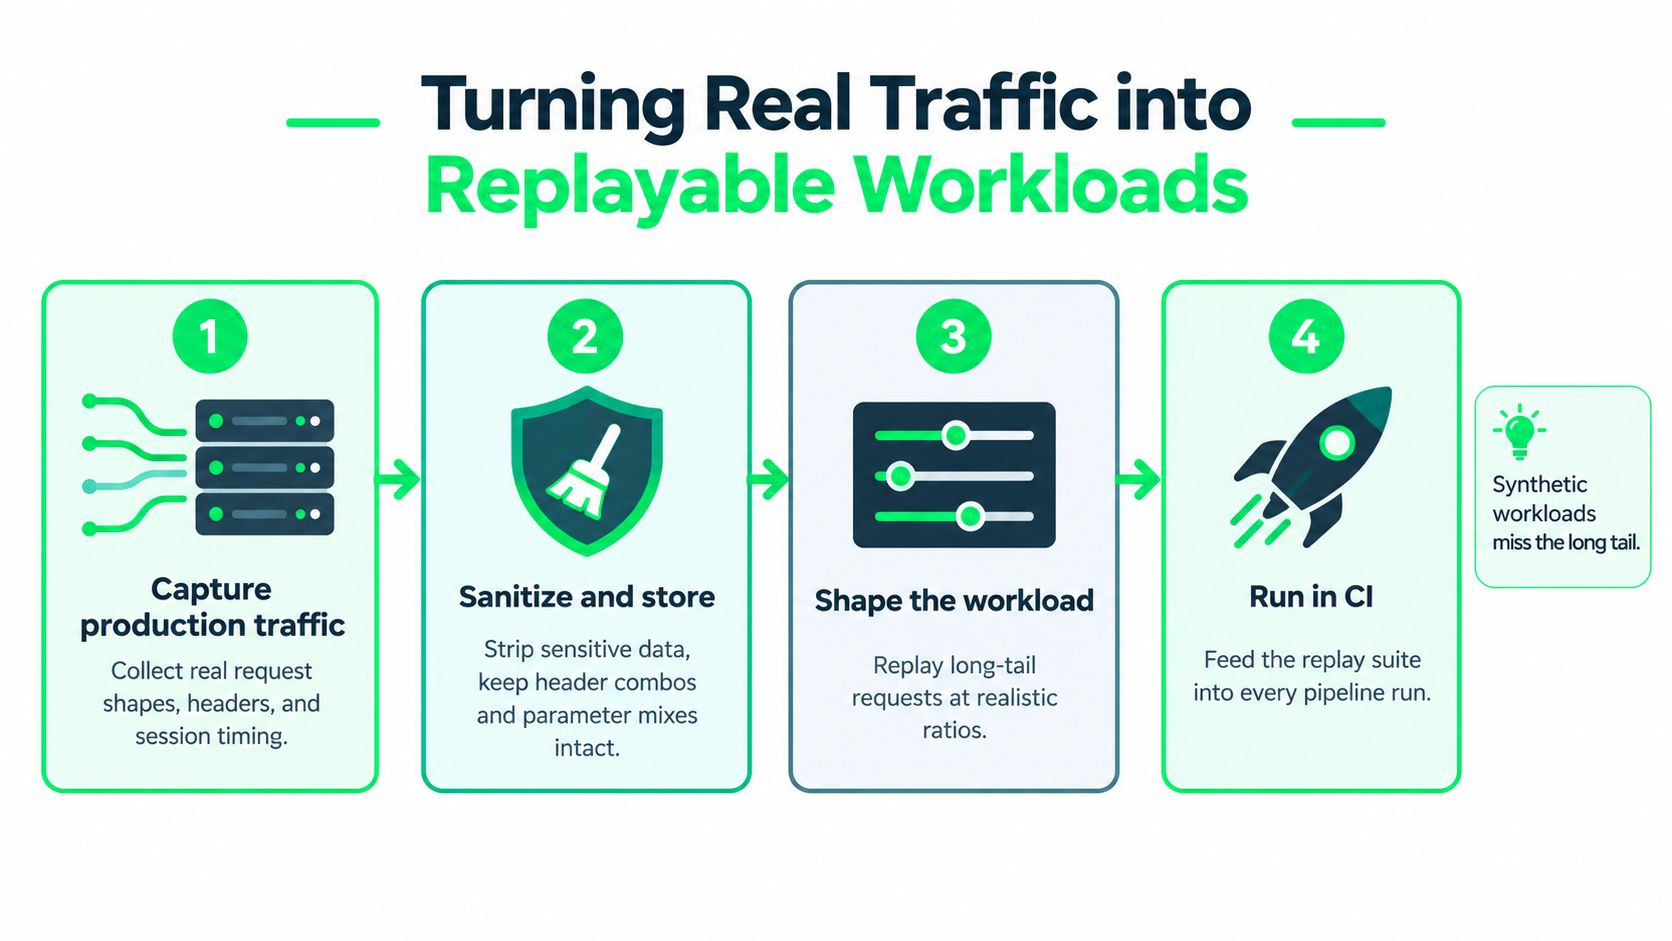
Parameterize the same artifact for smoke, steady-state, and incident replay. An incident-derived chain should be runnable at a controlled rate in a test environment, with production identifiers replaced by safe fixtures. The Faberwork LLC Wallaby testing story is a useful resource for thinking about how repeatable testing artifacts fit into a developer workflow, even though the workload format and performance objective may differ.
For packet-oriented traffic, preserve the chain rather than flattening it into isolated requests. The guide to replaying PCAP traffic covers the practical concerns around converting captured network behavior into a repeatable replay process. The important operating principle is that an incident trace shouldn't disappear into an operations ticket. It should become a reviewed regression fixture.
Metrics That Catch Regressions Before Customers Do
A single average latency number can make a broken service look healthy. If most requests complete quickly while a smaller group waits behind a queue, the mean may move only slightly even as customers experience timeouts or visibly slow interactions.
Tail latency provides the sharper signal. Track p95 and p99 alongside median latency, because the tail reveals contention, uneven routing, slow dependencies, and resource starvation. Throughput must be interpreted with latency and errors. A system that handles more requests by allowing queues to grow isn't necessarily faster.
Separate application behavior from test infrastructure
Every run should identify the commit, service, workload, environment, deployment, runner, and generator configuration. Collect application and infrastructure telemetry separately from generator telemetry. CPU, memory, network, garbage collection, connection pools, queue depth, and database wait indicators can show whether the application degraded or the runner ran out of capacity.
Error rate also needs context. Break it down by endpoint class, status family, dependency, and failure phase. An aggregate error percentage can hide the fact that checkout is failing while a high-volume health endpoint remains successful.
| Metric | What It Tells You | Why Averages Mislead | Recommended Collection |
|---|---|---|---|
| Median latency | Typical request experience | It excludes the slow tail | Store median with p95 and p99 |
| p95 and p99 latency | Customer-visible contention and outliers | A mean can conceal queueing and rare failures | Compare distributions against a controlled baseline |
| Throughput | Sustainable work completed | Higher throughput can mask rising latency and errors | Record achieved rate with latency and error data |
| Error rate | Correctness under pressure | Aggregates can hide endpoint-specific failures | Segment by endpoint, status, and dependency |
| Resource saturation | Capacity pressure and bottlenecks | Averages can hide short exhaustion periods | Correlate application and infrastructure telemetry |
| Run validity | Whether the result is trustworthy | A green result may come from too little traffic or an unstable runner | Enforce request-count, duration, warm-up, and environment checks |
The summary a senior reviewer needs is compact: tail latency, sustainable throughput, error rate, and saturation. Include the baseline comparison and a validity status beside those values. Don't make reviewers reconstruct the conclusion from a dashboard full of unrelated charts.
Statistical discipline matters because performance runners are noisy. Repeat samples and paired comparisons distinguish a code regression from environmental variance. A benchmark study on detecting performance changes found that 150 measurement pairs were sufficient for accurately detecting an injected change under its tested configuration, offering a useful starting point for sensitive comparisons rather than a reason to treat every project as identical. See the practical guidance on repeating performance tests when designing that comparison process.
Wiring Performance Tests into Your CI CD Pipeline
The pipeline job should be boring. It reads a scenario identifier, submits a run to an authorized test service, waits for a terminal result, uploads the raw artifacts, and returns a status that the CI system understands. Keep credentials in the platform's secret store, never in the repository or command output.
Use one runner contract for Jenkins and GitHub Actions
The REST interaction normally has four operations:
- Authenticate with a bearer token stored as a masked Jenkins credential or GitHub Actions secret.
- Submit a JSON payload containing the scenario, commit reference, environment, rate, concurrency, duration, and any permitted region or dataset selectors.
- Poll or stream a result endpoint until the run reports success, failure, cancellation, or an invalid environment.
- Fetch artifacts such as HTML, CSV, JTL, JSON, and telemetry references, then apply the gate to the structured result.
Don't hard-code a vendor-specific endpoint into application logic. Put the base URL, scenario name, and thresholds in protected CI variables, while keeping the workload definition and gate policy versioned with the project. The job should also register cleanup behavior so a cancelled build stops the remote run and releases injectors.
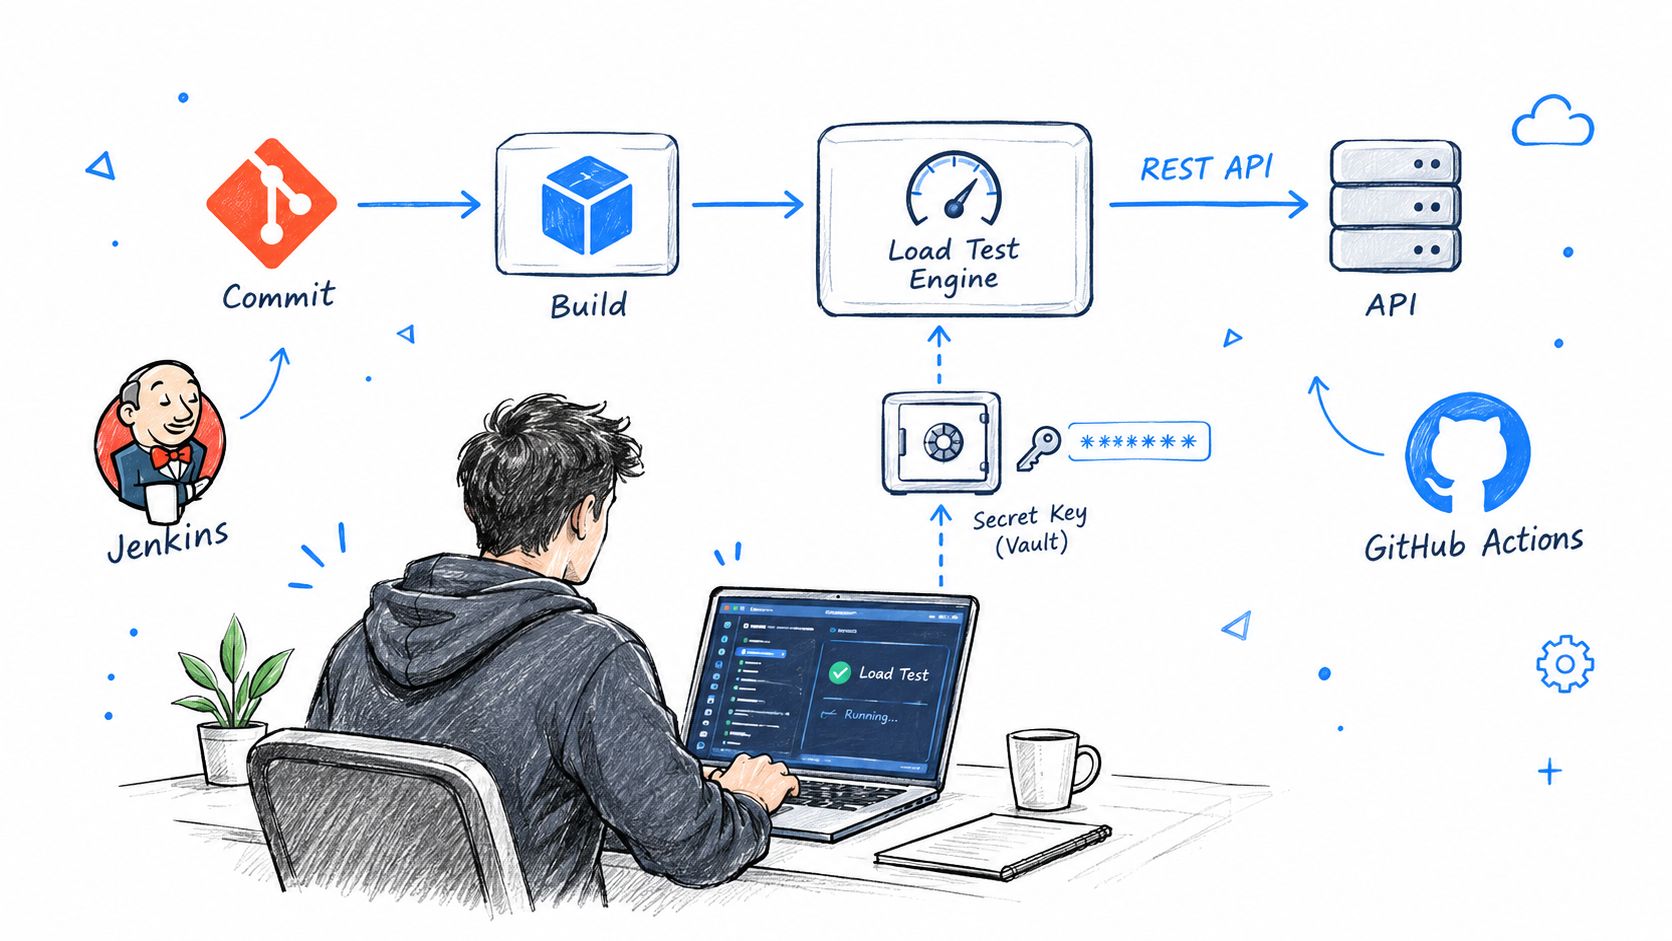
In Jenkins, use the HTTP Request plugin to send the JSON payload with a credential-bound authorization header. Store the returned run identifier in a build variable, poll with a bounded retry loop, and fail the stage only after the remote service returns a terminal failure or an invalid measurement. A post-stage block should upload reports and invoke teardown when the build is aborted.
GitHub Actions follows the same contract. Put the submit and poll operations in a reusable action or shell wrapper, then run independent scenarios in parallel when their environments and generators are isolated. A matrix can vary region, protocol, or workload profile, but don't confuse parallel execution with distributed realism. Multiple jobs sharing a constrained runner can contaminate one another.
A CI system should retain the raw report, not just a green or red badge. Historical artifacts let an engineer inspect a percentile shift, verify a workload change, and compare infrastructure metadata after a disputed result. The guide to automating network load tests in CI is useful when the workflow needs to coordinate network-level scenarios alongside application checks.
The pipeline should also distinguish test failure from infrastructure failure. A missing environment, exhausted injector, authentication error, and application regression need different owners and different retry behavior. For deployment safety, consult this guide to CI/CD canary releases when deciding how performance evidence should influence progressive exposure rather than acting as an isolated merge signal.
Building Pass and Fail Gates You Can Defend
A gate becomes defensible when an engineer can explain where its threshold came from, what evidence supports it, and what happens after it fails. A number chosen because it feels strict will either block healthy changes or approve harmful ones.
Anchor the gate to a published SLO first. Then compare the current run with a controlled baseline using the same workload, environment class, warm-up policy, and collection method. Use both absolute conformance and relative regression. A run can remain inside the SLO while moving sharply in the wrong direction, or it can exceed a tight threshold because the environment is invalid.
The comparison process needs enough repeated observations to distinguish signal from runner noise. Don't flag a release from one volatile run. Use paired samples, a minimum request and duration requirement, and a documented effect-size threshold. The research guidance on CI/CD performance gates recommends repeated samples, percentile latency, controlled environments, and a benchmark configuration using 150 measurement pairs for sensitive change detection, as described in the performance-change evaluation study.
Separate hard gates from warnings
Use a hard gate when the result violates a customer-facing SLO, breaches an error budget, or reproduces a known incident pattern. Use a soft gate when the signal is useful but the test is exploratory, the baseline is immature, or the change is an intentional capacity trade-off awaiting review.
A practical policy might look like this:
- Smoke gate: Block a merge when the service fails basic latency, error, or validity criteria.
- Steady-state gate: Block promotion when tail latency, throughput, or errors breach the agreed service budget under representative traffic.
- Endurance gate: Warn or open an incident-quality ticket when a scheduled run shows gradual degradation, unless the test reproduces a release-blocking failure.
- Override path: Require an owner, reason, expiry, and linked decision for every temporary threshold change.
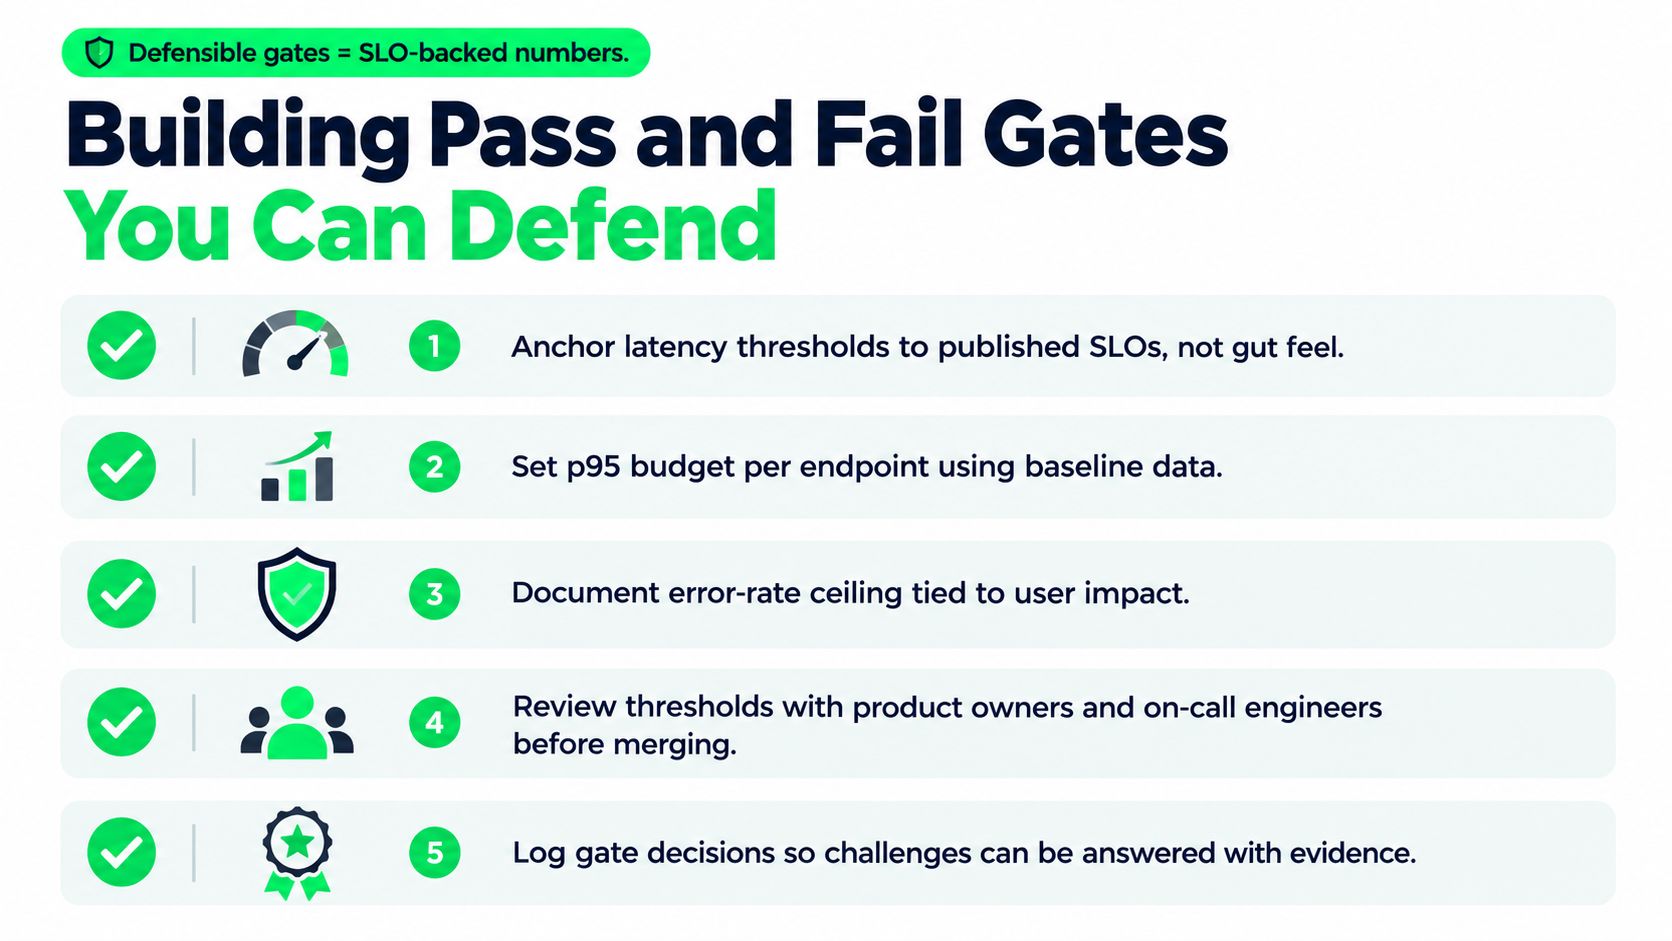
The gate decision should be an auditable artifact. Record the threshold version, baseline identifier, run validity, observed percentiles, error budget result, and approval history. If a product owner asks why a deployment stopped, the answer should be evidence from the service contract, not a tester's personal preference.
Troubleshooting Noisy and Flaky Performance Results
Flaky performance tests aren't an unavoidable tax on automation. They usually indicate that the team hasn't controlled a variable, separated ownership, or defined what makes a run valid. Retrying until the job turns green hides the problem and teaches developers that the gate can be ignored.
Shared runner contention
A load generator and the system under test compete for CPU, memory, network, or disk. The result is inflated latency that looks like an application regression.
Detection: Compare generator CPU and network telemetry with the application's telemetry, and inspect whether unrelated jobs overlapped the run.
Fix: Pin injectors to controlled runners, reserve capacity, and prevent unrelated workloads from sharing the measurement environment. Reject the run when the generator reaches its own saturation boundary.
Missing warm-up
Cold caches, JVM compilation, connection establishment, autoscaling, and lazy initialization can dominate the first part of a run. Mixing that startup behavior with steady-state samples produces an unstable baseline.
Detection: Plot latency and throughput over time instead of reading only the final summary. A sharp early transition usually indicates warm-up or ramp behavior.
Fix: Add an explicit warm-up phase, exclude it from the measured window, and keep the policy identical across baseline and candidate runs. Warm-up isn't a cosmetic delay. It defines which operating state the test is measuring.
Cache and data contamination
A first run may populate Redis, database buffers, application caches, or test fixtures. A later run then appears faster without any code change. Stateful endpoints can also fail because previous iterations consumed or mutated the same records.
Detection: Compare cold and warm runs, inspect cache and database state, and assign every run a dataset namespace. A result that changes materially with reset state isn't yet a stable regression signal.
Fix: Reset or isolate test data, seed fixtures deterministically, and keep load tests away from shared development environments. For stateful flows, generate unique safe identifiers at runtime while preserving the captured request sequence.
Time-of-day and infrastructure variance
Cloud neighbors, autoscaling policies, background maintenance, database load, and regional routing can change results independently of the commit. Comparing a daytime candidate with a quiet baseline creates false confidence in either direction.
Detection: Store region, instance shape, deployment identifier, autoscaling state, database state, runner identity, and test timestamp with every artifact. Cluster results by comparable environment rather than combining incompatible samples.
Fix: Run scheduled endurance tests in a consistent window and compare them with baselines from the same class of environment. Never mix regions, hardware profiles, database states, or scaling modes without labeling the comparison.
Runtime and connection behavior
JVM warm-up, garbage collection, DNS caching, TLS reuse, connection-pool limits, and keep-alive behavior can alter tail latency. A test may look healthy because connections remain warm, while a customer path that opens new connections remains slow.
Detection: Correlate p95 and p99 changes with garbage-collection pauses, pool wait time, DNS resolution, connection creation, and dependency latency. Capture these signals from the system under test, not only from the load tool.
Fix: Define whether the scenario models warm or cold connections, preserve that choice across runs, and report pool and dependency metrics beside response latency. Don't “fix” an unexplained tail by increasing timeouts.
| Failure Mode | Symptom | Detection | Fix |
|---|---|---|---|
| Shared runner noise | Latency changes without matching application pressure | Inspect generator saturation and overlapping jobs | Isolate injectors and reject contaminated runs |
| Missing warm-up | Early samples are much slower or more variable | Plot metrics across the run | Add a measured warm-up policy |
| Cache contamination | Later runs improve without code changes | Compare reset and warm-state results | Isolate caches and reset fixtures |
| Environment variance | Results shift by region or schedule | Compare metadata and matched windows | Use controlled environment classes |
| Runtime behavior | Tail spikes align with GC, pools, or connection setup | Correlate application telemetry with percentiles | Model connection state explicitly |
The delivery metrics provide a useful reason to fix these problems rather than tolerate them. DORA's framework connects deployment cadence and lead time with change-failure rate and failed-deployment recovery time. The DORA metrics guide defines those measures and emphasizes that delivery throughput and stability should be considered together. A noisy gate increases lead time and encourages bypasses. A trustworthy gate can reduce change-failure risk by catching regressions before deployment, while a replayable incident workload improves recovery work after a failure.
A practical rollout can start small:
- Capture one representative or incident-derived workload. Completion means the sanitized artifact runs outside production and produces a repeatable report.
- Add the smoke job to the merge path. Completion means every applicable change publishes latency, errors, validity, and commit metadata.
- Add SLO-backed gates with statistical guards. Completion means the policy records the baseline, sample requirements, threshold version, and decision reason.
- Move the longest test to a scheduled job. Completion means endurance results are retained, compared with a matched baseline, and routed to an owner without delaying routine feedback.
- Review delivery outcomes. Completion means the team can correlate performance failures with deployments, incidents, recovery work, and pipeline bypasses.
The target isn't a perfect test lab. It's a delivery system that measures the risks it claims to control, rejects invalid evidence, and turns customer-facing incidents into repeatable tests.
RETRO//STRESS provides authorized Layer 4 and Layer 7 testing, packet-chain and PCAP replay, and REST API or CLI automation for CI/CD resilience workflows. Use RETRO//STRESS to turn incident-derived traffic into versioned replay evidence and build performance gates that your pipeline can run repeatedly.